Knowing how much volume of silage inventory you have is very important. And it’s a question drone technology can answer very well. However, it just scratches the surface of the vast amount of questions, answers, and actions that can form from good inventory management combined with the right silage inventory measurements. With the right data available, we can finally begin measuring some KPIs that have been very challenging, or even impossible, to accurately and consistently measure before.
Density. A variable that contributes to half of the equation that solves for how much inventory is on your farm (volume * density / 2000 = tons). Not only will it directly impact the total inventory available, but is also a direct indicator of how well you did packing the pile – which of course has many of its own implications.
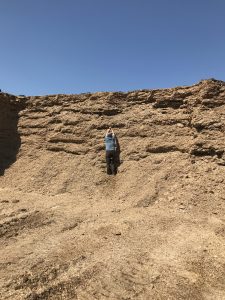
This isn’t a metric that has been impossible to measure in the past. All you need is a drill with a probe…and the acceptance of risk to go up to a thousand pound face of a pile, where it could collapse at any moment, and drill into it – not once but SEVERAL times. I think we can all agree that isn’t an ideal method, and further – there are many variables that impact this related to where you take the probe sample.
Instead, with our modern drone solution we can simply calculate this value with the assistance of load data from feed software. We take the volume / lbs of feed used (measured from feed software), and we have the density of the portion of the feed that was used. Now of course, the density of the feed is not always universal throughout the entire pile. Oftentimes there is a significant change in density from the edge of the pile to the center of the pile. Fortunately, drones make it very easy to measure and track that density throughout the pile, which we can interpolate the entire pile density which results in more accurate estimations for run-out and our next metric – shrink.

Shrink. More of a term than metric that has many definitions on a dairy farm. The mystery value that undoubtedly is equivalent to many many thousands of dollars of lost values. Something that has been nearly impossible to accurately measure before – but now actually quite easy with the right inputs. But first, let’s break down the two generalized categories of shrink we can measure:
Fermentation Shrink: This can be defined as the dry matter loss due to the fermentation process. There are many ways to try to mitigate this but it’s always going to exist. But for us, this is quite an easy measurement. We simply fly the drone immediately after the feed is packed, and then measure again before the bunk/pile is opened. That change in volume between those two points in time can be considered the shrink.
Operational Shrink: This can be defined as the lost feed during the entire feeding process. This metric is a slightly more challenging to accurately measure, as we will need accurate load data from Feed Software. However, if we have consistent load data, we can compare the disappearance of volume and gauge the volume disappearance vs the actual weights.
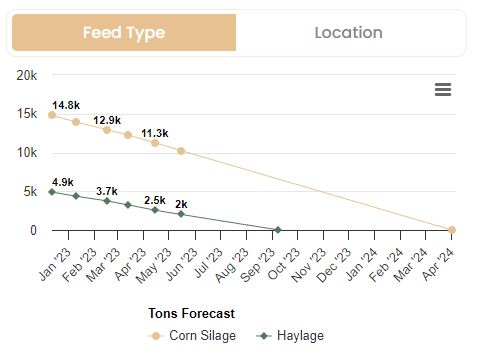
Forecasts (or Runouts). Just as it is important to know how much feed inventory there is, it is also critical to know when that inventory will reach zero. The last thing any farm wants is to be short on feed, or have to abruptly change diets. Our dashboard has a forecasting algorithm that takes into account a number of factors that allow for pre-planning feed purchases, transitions, and the next year’s crop plan months – even years in advance. Further, you are able to customize the forecast inputs on the dashboard, allowing you to plan for any upcoming changes in ration changes, feed transitions, or change in number of cows.

There is a lot of power in accurately measuring your silage feed inventory. Our solution is not only a volume measurement but a tool that can help you answer some of the most important questions about the highest cost on a dairy farm. By harnessing this data you can potentially save thousands of dollars, many hours of your time, and optimize feed consistency to maximize revenue.


